Each week, K Street Analytics publishes a separate analysis of the federal government relations landscape in Washington, analyzing patterns across lobby-filings, PAC activity, and campaign contributions.
In today’s issue, we look at the governmental departments that received the most attention from K street in 2023/Q3.
The CliffsNotes version:
82% of all lobby-filings involved lobbying the House, and 81% involved lobbying the Senate.
According to our estimation, 37% of all lobbying-expenses went into lobbying the House, and an almost identical 36% went into lobbying the Senate.
There is massive rank-stability over time in both the number of lobby-filings and the money spent by department: On both metrics, departments’ 2023/Q3 rank is almost always nearly identical to their average over the previous four quarters.
1. Base
Historically, by November 7th about 96% of all quarterly filings for Q3 should be reported, but 4% will be late. For comparability, we drop Q2-filings posted after August 7th, Q1-filings posted after May 7th, and 2022/Q4-filings posted after February 7th 2023 when we make comparisons across quarters, in order to create consistent comparisons across quarterly aggregates.
We use two metrics to measure the attention a branch of the government received from lobbyists: the number of filings that involved a specific department, and the money involved in those filings, i.e. the reported income of lobby-firms plus the reported expenses of internal lobbyists (which are a function of organization-internal salaries and share of time spent on lobbying).
To calculate the second metric, we need to perform the following back-of-envelope calculation: Income and expenses are reported as a single number for each quarterly filing, which aggregates all lobbying activity associated with one registration. Each filing lists issues (at least one, but possibly many), and under each issue, we have two separate “tuples”; we have a list of lobbyists involved in an issue, and we have a list of government departments that were lobbied on an issue. We may see five registered lobbyists and one government department listed under one issue, or we may see the opposite counts. What therefore break each lobby-filing into its component “issue-lobbyist tuples”, and assign each tuple an equal share of the filing’s overall money-value. We then aggregate these shares up to the issue tuple (something we will use in 2023/Q3 issue #5, when we look at issues lobbied on). We finally break this number down equally across the government branches lobbied under each issue in a filing. (Alternatively, we could break a filing equally across all "issue-government tuples”, but in our view it gives a more accurate estimate to divide attention equally across the lobbyists involved on an issue.
Exhibit 1 shows the top-departments ranked by the number of unique filings they are involved in (Frank#). Both chambers of congress are involved in more than 80% of all filings (0.8*19,213=15,370). This pattern stands in polar-opposite contrast to lobbying in parliamentarian systems like Canada and Europe, where the majority of lobbying is directed at civil servants. In our Canadian sister publication Queen Street Analytics for example, more than 90% of lobby-filings are involve civil servants, not legislators.
Exhibit 1 shows the top-30 departments lobbied by filing. The last two columns consider our second measure of attention, money (income + expenses). Money is listed in thousands of dollars, i.e. almost 414 million dollars were spent on lobbying the House in 2023/Q3. Exhibit 1 shows that the two attention-measures “Frank” and “Mrank” give very consistent rankings, with a few notable exceptions like Department of Transportation (where the average filing has less money associated with it) and the Office of the President (EOP) where the average filing has more money associated with it, arguably because access to the EOP is more expensive.
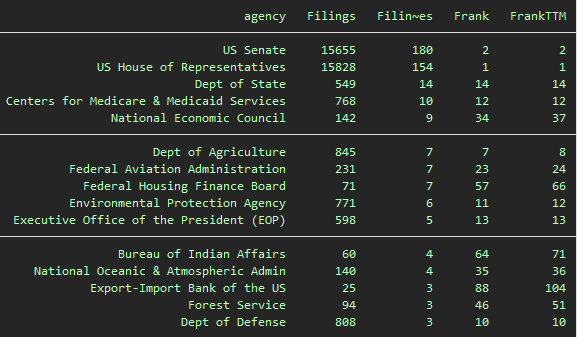
Next, we consider how stable Mrank and Frank are over time. To do so, we run a simple prediction model of filings over 5 quarters (2023/Q3, plus the previous 4 quarters). In Exhibit 2, we show the biggest movers in the number of filings (column 3 is the deviation in #Filings from estimated trend). Given how top-heavy the data is towards the two chambers of congress, it is easy for House and Senate to dominate the top of the list (although they could just as easily dominate the bottom of the list, which they usually do during Q2 because of summer-recess).
Even outside of the “big two,” however, Exhibit 2 mostly paints of picture of enormous stability in who gets lobbied how much. The State Department has the third-biggest deviation form trend (with 14 extra filings), but 14 filings are still a drop in the bucket so that its filing-rank in 2023/Q3 (Frank) is exactly the same as it was on average over the trailing four quarters / twelve months (FrankTTM).

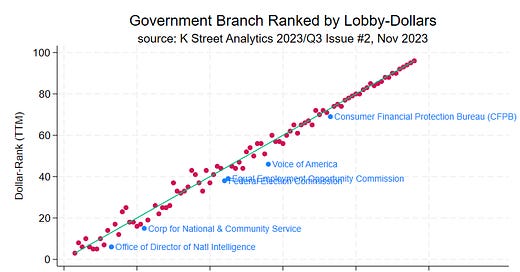
Exhibit 3 and 4 show this extreme stability in more visual form, plotting departments’ Frank and Mrank in 2023/Q3 against their average rank over the previous four quarters (TTM). Along both metrics, the heavily lobbied departments in the top-right show a picture of almost complete inertia, as most scatter-points line up almost perfectly on the 45-degree line. We attach department-labels on the whatever minor deviations there are to the right of the 45-degree line. On filing-rank in Exhibit 4, we see a little bit more variation around the 45-degree line in the bottom-left, but this is mostly noise because rank can change so easily when the number of quarterly filings is in the low double-digits.
2. Aggregating Departments
About half of the 200+ departments listed in the lobbying-filings are actually subordinate to other departments. We therefore take a separate look at the data when we aggregate up the subordinate departments among the 200+ reported. (We also aggregate the health-related agencies FDA, NIH, CDC, and NIAAA, and the environment-related agencies EPA and CEQ (Council on Environmental Quality).)
Most notable in Exhibit 5 compared to Exhibit 1, this aggregation moves up the White House (which absorbs the EOP) and the Department of Defense (which absorbs Army, Navy, Air Force and the Marine Corps, among others). It also moves the combined health agencies into position 15.
The consistency we observed in Exhibit 1 between our two measures of attention (Frank and Mrank) remains largely unaffected by our data-aggregation.
Is the over-time stability in Exhibit 3 and 4 affected by aggregating up the departments? Not really. Exhibit 6 paints a similar picture of stability as the one we saw before, the majority of aggregated departments clustering very tightly around the 45-degree line.

This concludes our Q3/2023 newsletter issue #2. Overall, the extreme degree of over-time stability that we observed in today’s issue makes for a somewhat boring newsletter. So expect issue#2 to get folded in with issue#1 in our next quarterly reporting cycle in February 2024, and expect issue#2 to be replaced by a new topic of analysis next cycle.


