Each week, K Street Analytics publishes a separate analysis of the federal government relations landscape in Washington, analyzing patterns across lobby-filings, PAC activity, and campaign contributions.
In today’s issue, we look at the top lobbyists in 2023/Q3.
The CliffsNotes version:
There were 4,384 lobbyists listed in lobby-firms income filings in 2023/Q3.
There were 6,047 in-House lobbyists listed by firms handling their own GR work in 2023/Q3.
The top-3 inferred-income numbers among lobbyists, each in excess of 1 million USD, accrued to owners of lobby-firms who remained actively involved in their firms’ lobbying activities
Each lobby-filing comes with either an income amount (if an external lobby firm is used) or an expense amount (if lobbying is handled in-house). To assigns these incomes and expenses to individual lobbyists, we do the following: Each filing’s aggregate income and expenditures are divided across its reported subject-matters, where each subject-matter has a number of lobbyists assigned to it in the filings. For example, consider a 10,000 filing involving three subject-matters, and five lobbyists working on the filing, as follows
subject1: Jim, Jane, and Josh
subject2: Jim, Jane, and John
subject3: Jim, Jane, Josh and Jordan
We assume that each subject-lobbyist tuple earns the same share of an overall filing. In the above example scenario, there are ten subject-lobbyist pairs, and this means this means we assign 3,000 of income to each of Jim and Jane, 2,000 to Josh, and 1,000 each to John and Jordan. In short, we disassemble the filing-level dollar-amounts into filing-subject=lobbyist components, and then reassemble them into lobbyist-amounts.
We then sum up all filings that a lobbyist was involved in to generate a lobbyist’s quarterly total inferred income or expense.
This quarterly total is an estimate of an individual’s direct contribution to their firm’s lobbying income, and should not be misconstrued as a measure of an individual’s actual income. Firstly, a large part of the income earned accrues to the lobby-firm, not the individual so that an individual’s income may be much below the inferred-income. Secondly, an individual’s actual income can be much above our inferred income: if an individual is paid W2 income, their income is not directly tied to their lobbying activity; and if an individual is a partner at a firm, their income will be a function of the entire firm’s income, not only the activities they were directly involved in.
We can perform this calculation for both in-house and external registered lobbyists. Exhibit 1 shows the distribution of inferred expenses calculated for the 6,047 in-house lobbyists involved in filings in 2023/Q3. with a median of 73,998, and a mean of 107,983, and at the very top we see the largest five inferred expenses fall between 850,000 and just under one million.
Exhibit 2 shows the distribution of inferred incomes for the 4,384 external lobbyists involved in lobby-filings in 2023/Q3. The inferred income distribution was fairly similar to the expense distribution in Exhibit 1: the median income was 73,330, the mean was 114,924, and at the very top we see the largest five inferred incomes each in excess of one million.
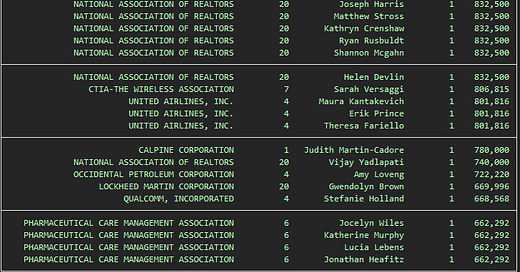
Next, Exhibit 3 takes a look at the top-30 inferred-expenses among the in-house lobbyists that underpin Exhibit 1.
At the top are two lobbyists who work at institutions with only a single registered lobbyist: Eric Maus with the Council for Citizens against Government Waste, and Richard Hunt with the Electronic Payments Coalition. With both organization only having a single lobbyists, all reported lobbying expenses are entirely assigned to them, although it seems highly probably in these two cases that the internal calculations of lobbying expenses involved positions other than salary. Next up are six lobbyist for the Chamber of Commerce. These six stood out among the Council’s 89 registered lobbyists because their names appeared on the largest number of subject-matters (and the Council lobbies on many subject matters). Similarly, eight out of the National Association of Realtor’s 20 registered lobbyists made the list, as did four of the six registered lobbyists with the Pharmaceutical Care Management Association, each with inferred expenses of 662,000 USD.
Next, Exhibit 4 does the equivalent for the top-30 inferred-incomes among the external lobbyists that underpin Exhibit 2. The top-3 inferred-income numbers among lobbyists, each in excess of 1 million USD, accrued to owners of lobby-firms who remained actively involved in their firms’ lobbying activities: Brian Ballard of Ballard Partners, Jeffrey Miller of Miller Strategies and Christopher Putala of Putala Strategies. In Mr Ballard’s and Mr Miller’s cases, they were merely the busiest lobbyists among their teams, while in Mr Putala’s case, he remains the only registered lobbyist in his firm, bringing in more than one million in income on his own. Darren Willcox did nearly as well as the only lobbyist in his firm W Strategies. The other top positions went to senior lobbyists at large firms like Akin Gump, Team SubjectMatter, and Crossroads.
In Exhibit 5 and 6 we compare the top-heavy income distribution in a firm like Ballard Partners, where Brian Ballard is involved in every subject-matter filing, to the more equal distribution of inferred incomes of Cassidy and Associates.
The top-3 inferred-income numbers among lobbyists, each in excess of 1 million USD, accrued to owners of smaller lobby-firms who remained actively involved in their firms’ lobbying activitiesXXXX
This concludes our newsletter’s issue #5 for 2023/Q3.


